Amplitude of Wind Fluctuations
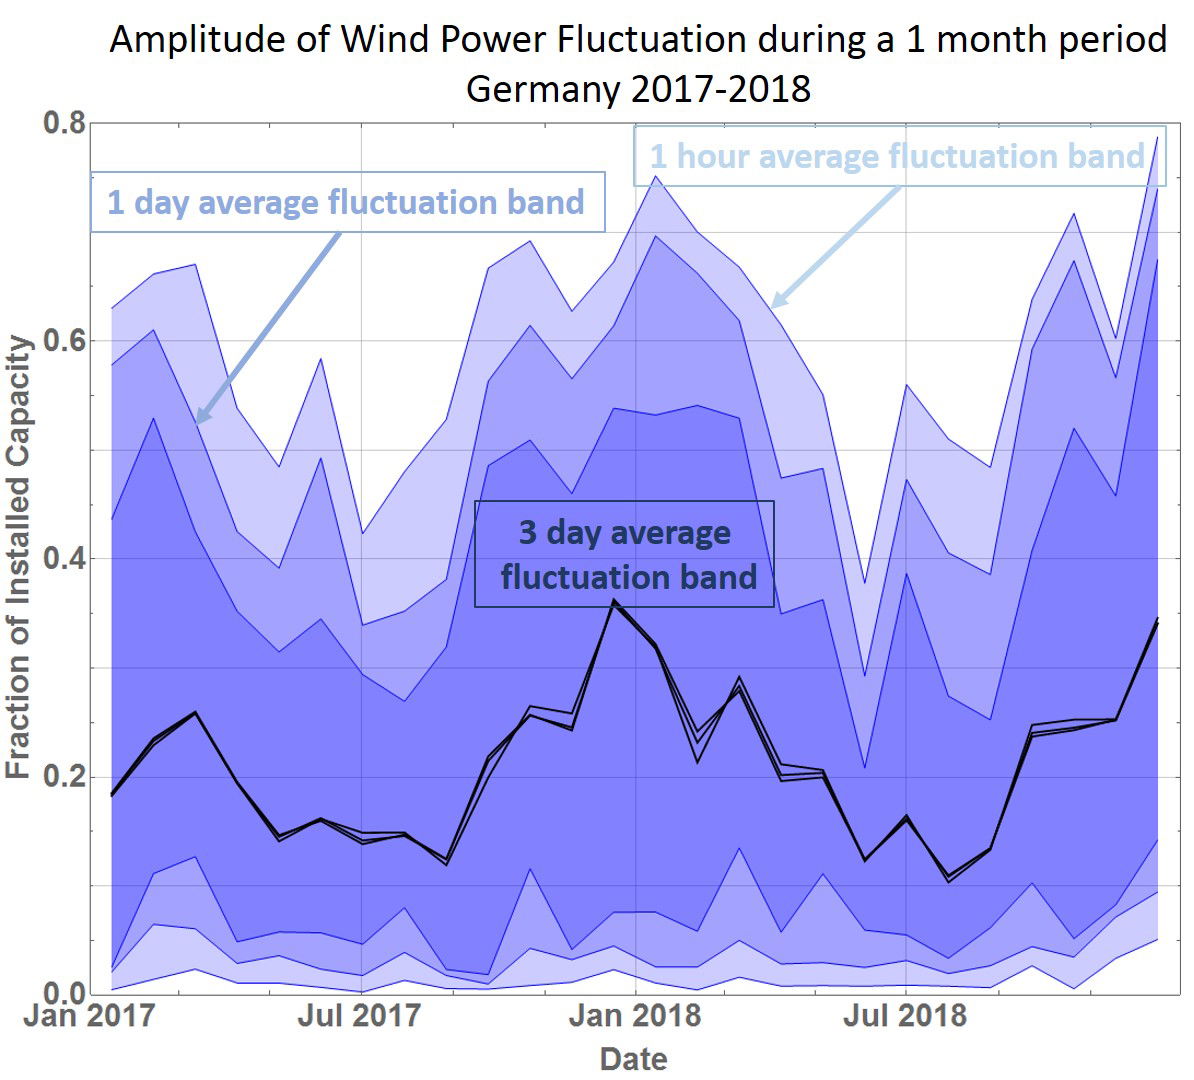
Knowledge of the amplitude of the fluctuation in wind power generation is essential to determining the properties of the required backup power source.
First plots are shown given the raw wind production data plotted as averages over 1 day for 3 years. Afterwards plots are shown to evaluate the amplitude of the fluctuations.
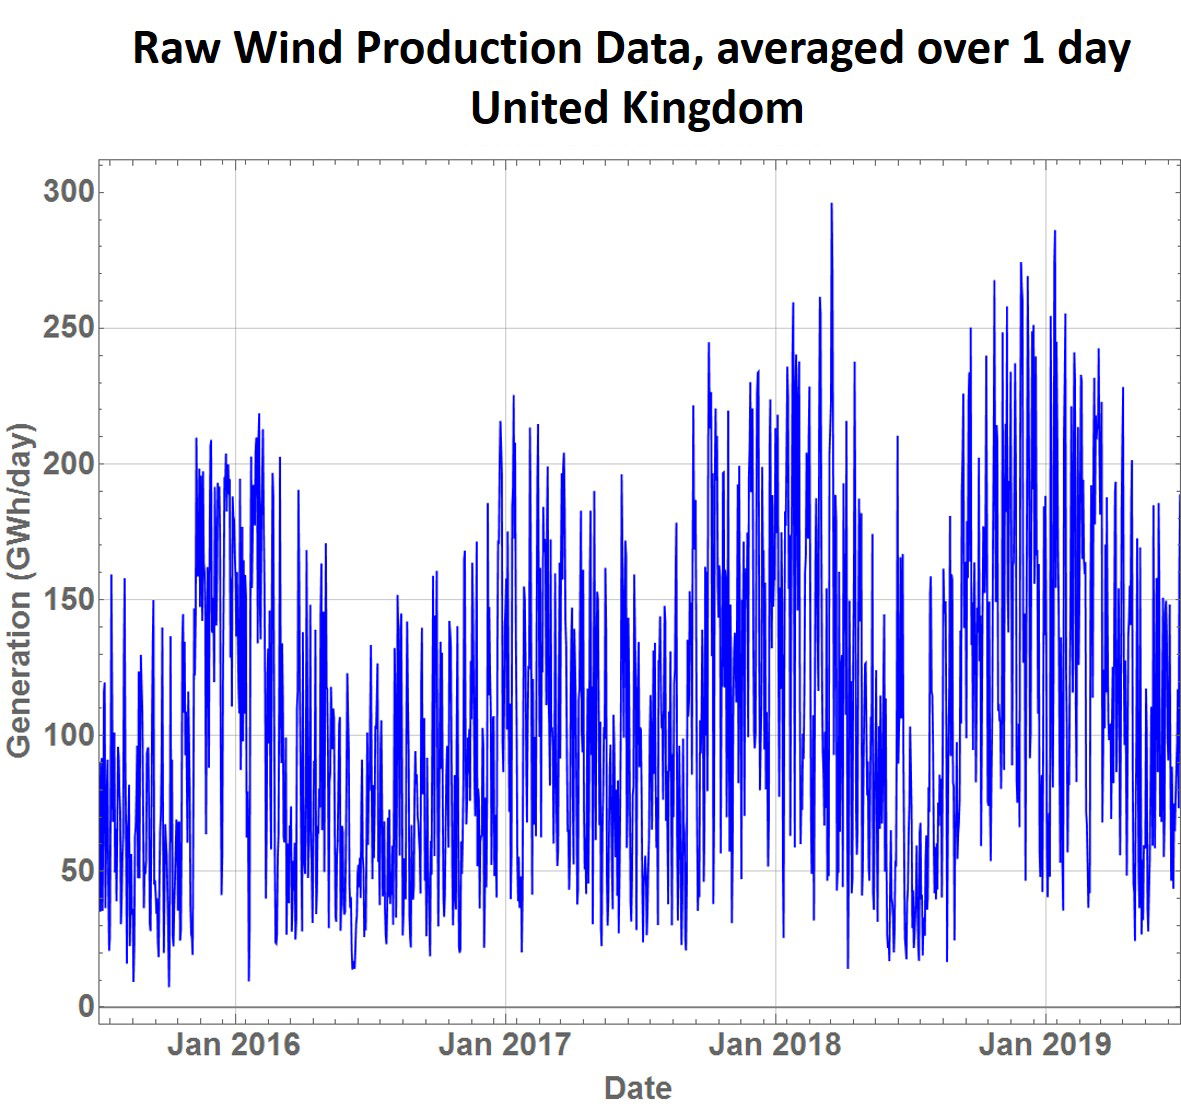
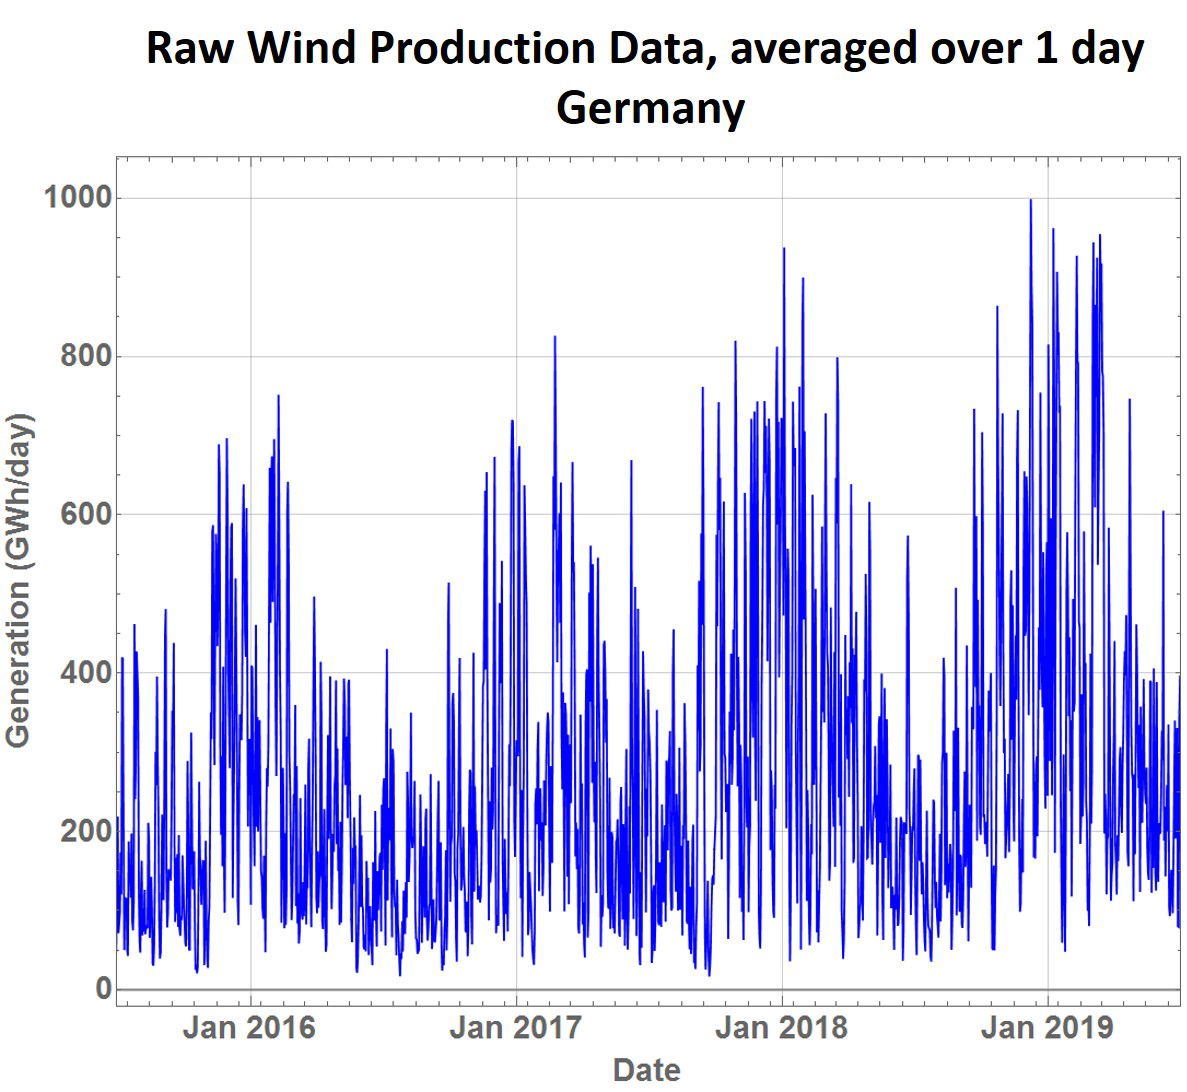 | 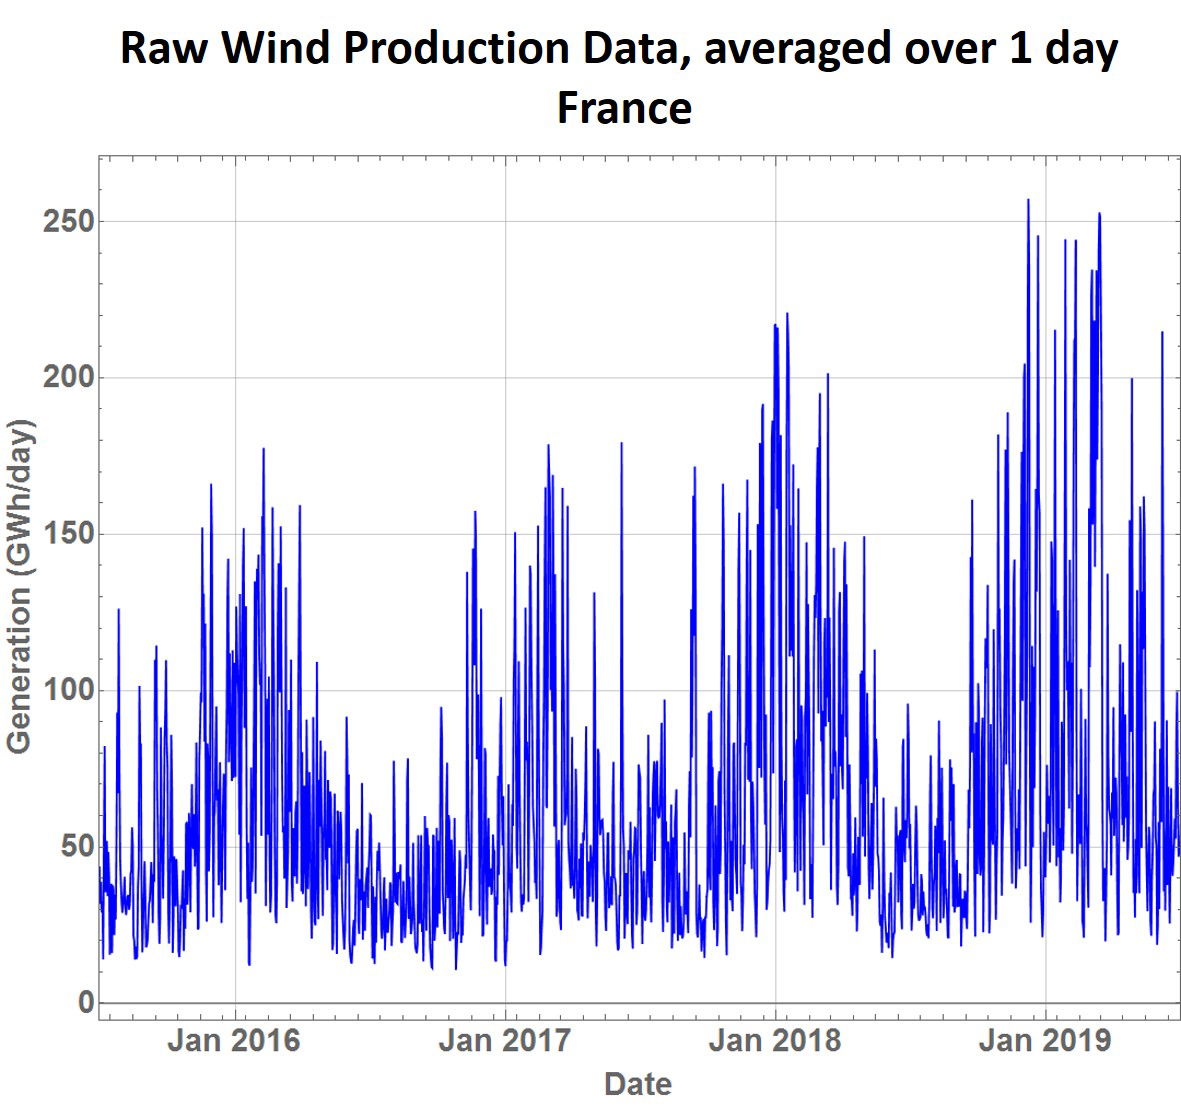 |
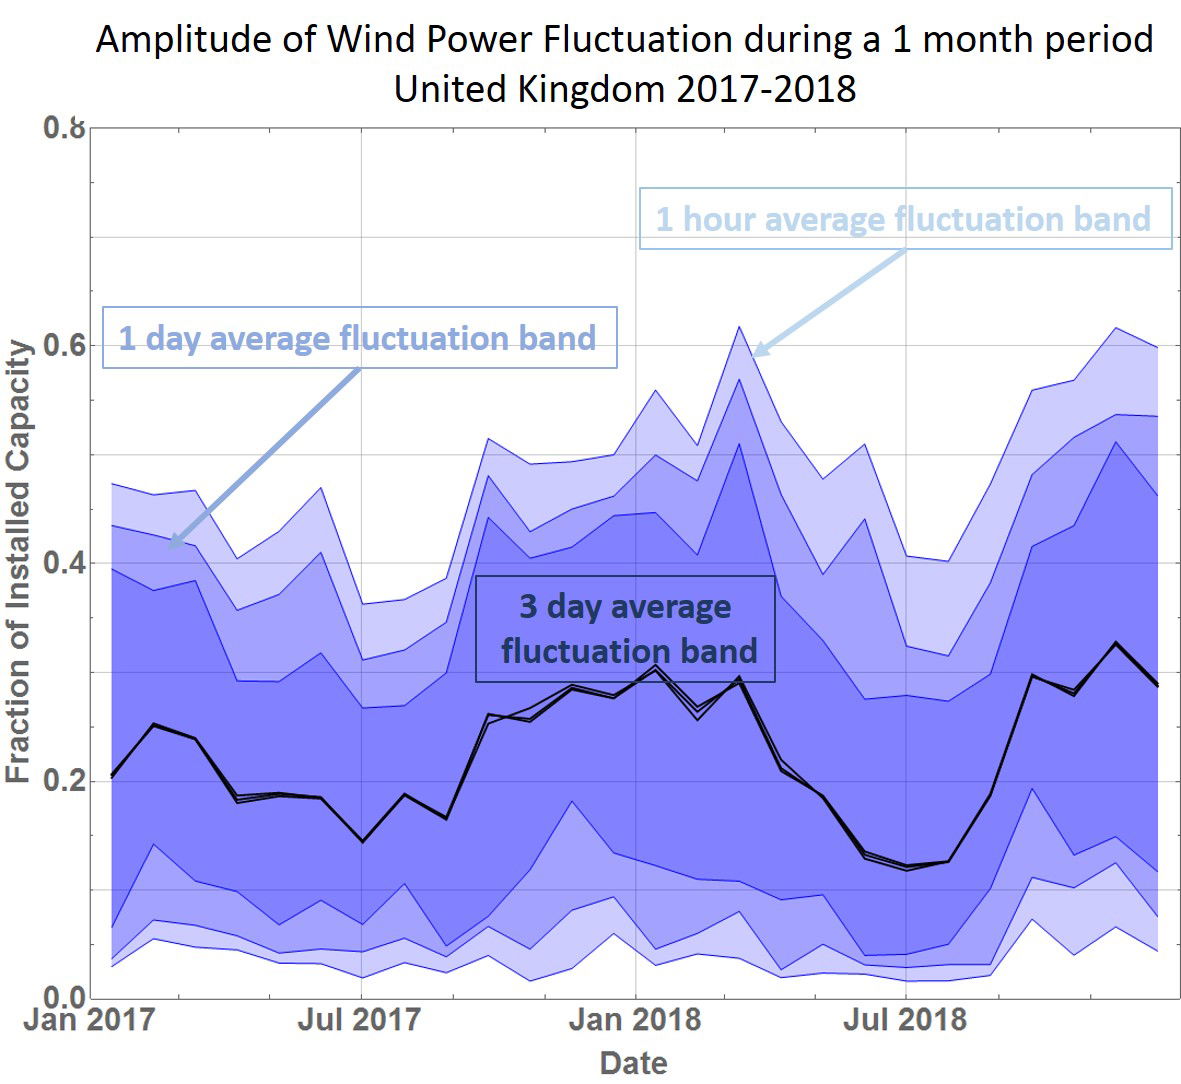
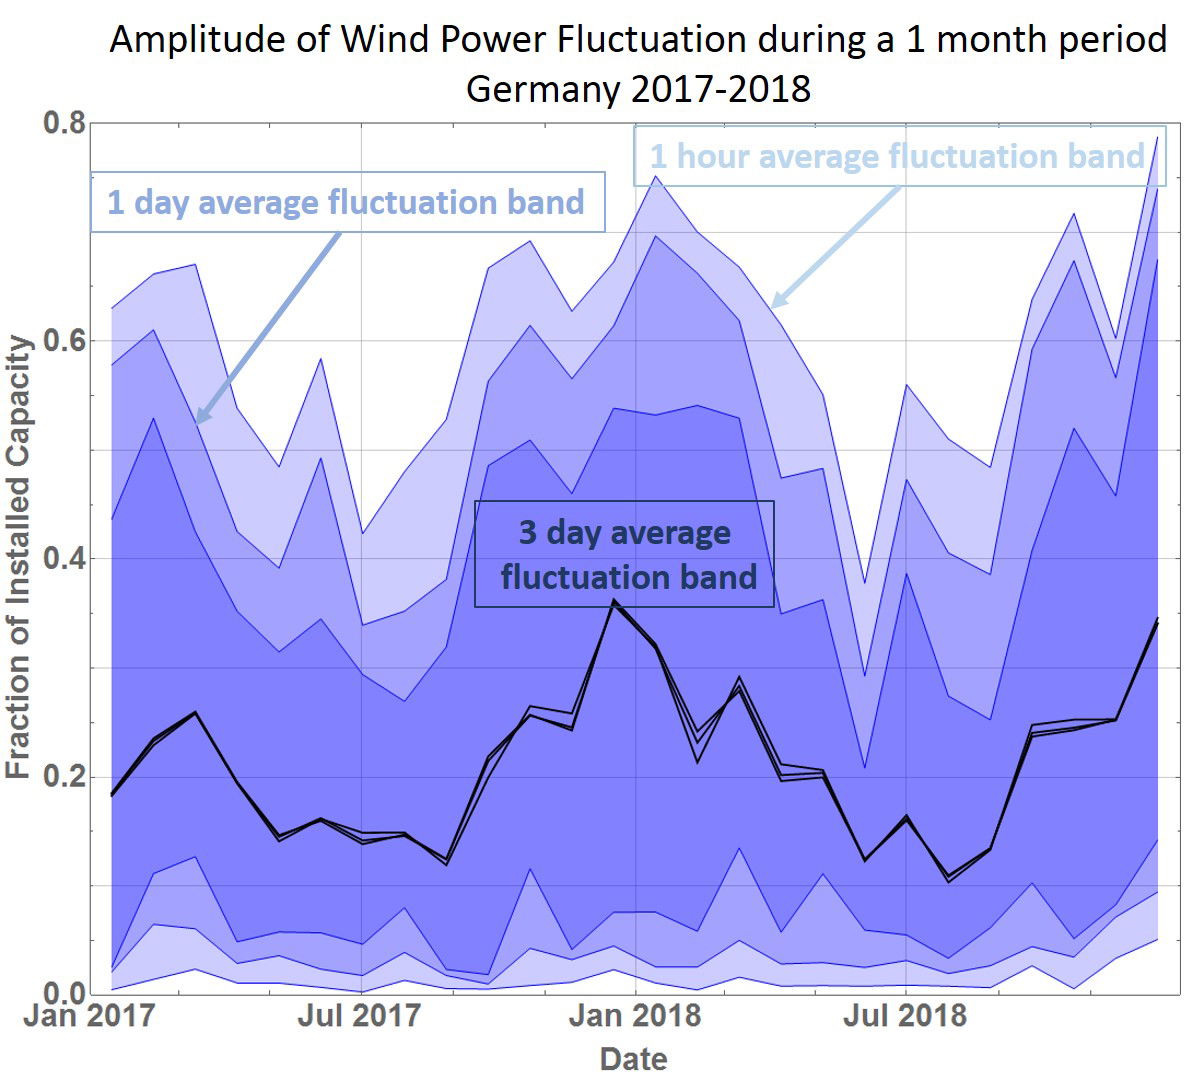
The next plots evaluate the amplitude of the fluctuations, as shown in the plots above, by taking averages of the data over periods of 1 hour, 1 day and 3 days. The bands in the plots below show the maximum, minimum and mean wind power during a month interval for these short term averages.
 |  |