Optimal PV Panel Orientation
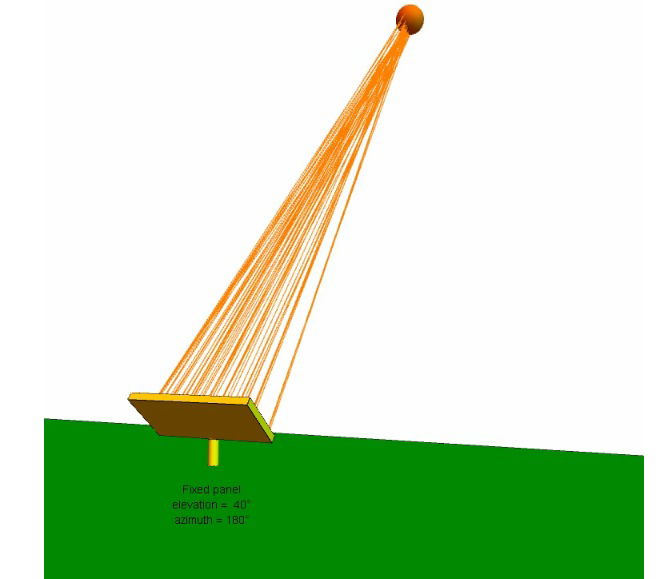
The animation below illustrates the movement of the sun in the sky for a location at latitude 50o and longitude 0o. The numbers in the top panel show the radiation power hitting the ground throughout the day, after absorption in the atmosphere using a flux of 1.5 KW/m2 at the upper atmosphere. The second number is the radiation flux incident on a photo-voltaic panel with fixed orientation. The generated power of the solar panel is further reduced by the panel conversion efficiency which is typically in the range 15-23%.
The table below shows the losses of solar power from different sources for a location latitude 500 with fixed orientation panels with elevation 500 pointing south.Weather effects are not included. The second column is the solar power arriving at the upper atmosphere during daytime; third arriving at ground after absorption in atmosphere; fourth incident on fixed orientation panel and fifth the electricity produced taking conversion efficiency times filling factor of 18%.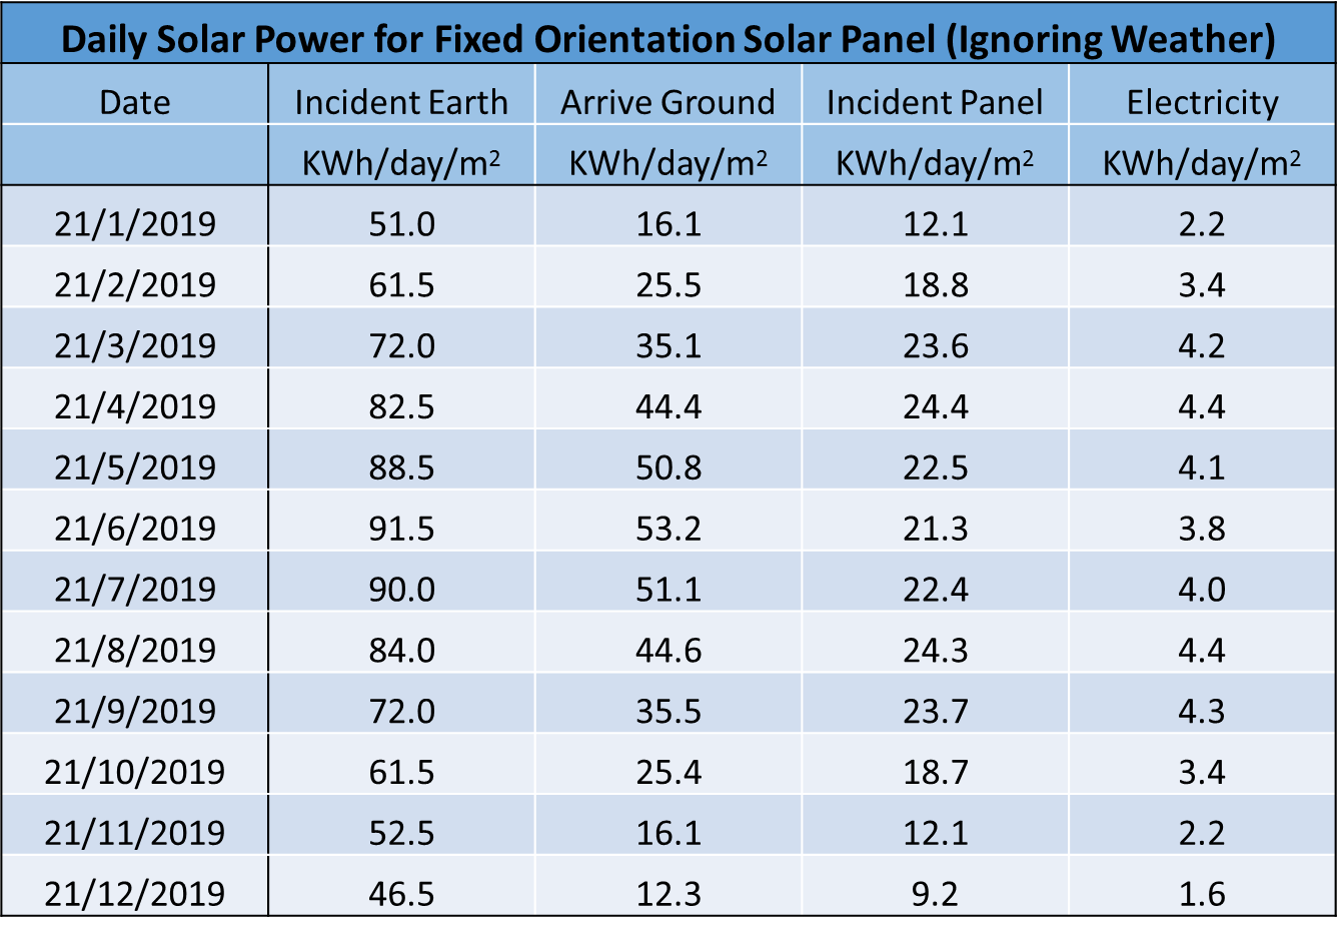
With the fixed panel the electrical power is about constant from March to September but much less in winter due to the atmospheric absorption for low elevation sun positions.
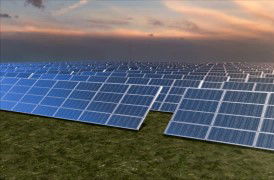
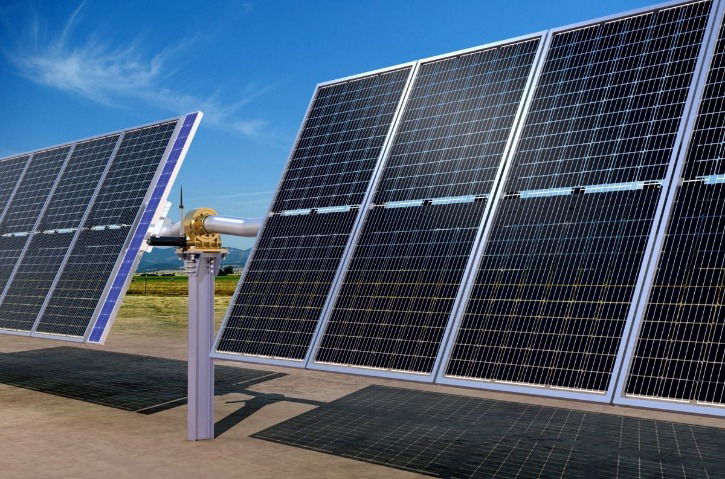
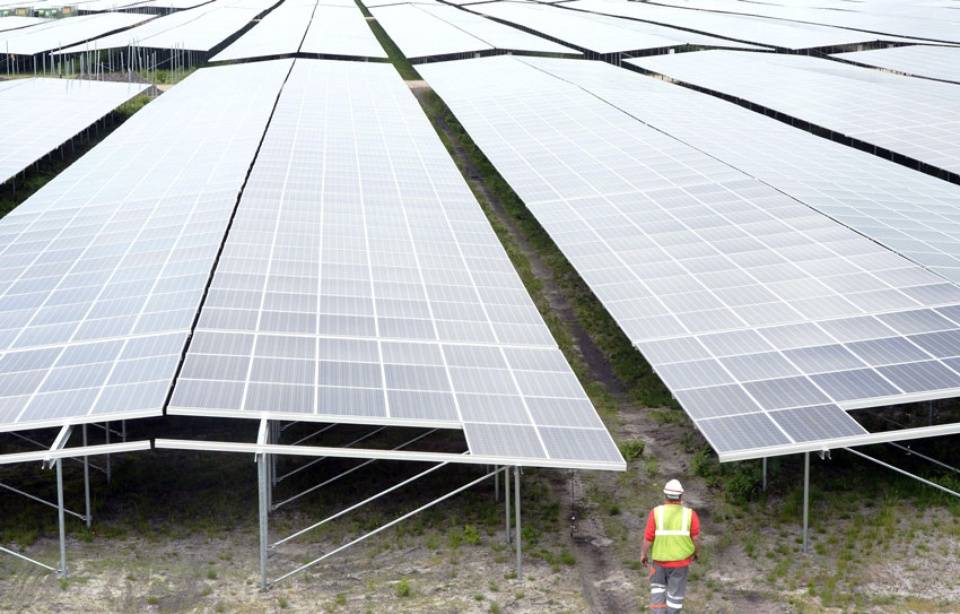
Examples of photo-voltaic panel orientations used on solar farms
Tracking sun in 2D | Fixed orientation, facing South |
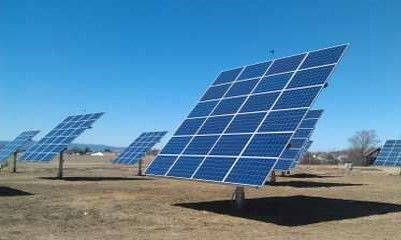 |  |
Tracking sun in 1D in elevation | Fixed orientation, facing East and West |
 |  |
By far the most frequent arrangement on solar farms is the have fixed orientation facing due south in the northern hemisphere and north in the southern hemisphere. The optimal orientation to maximize power output for different latitudes is shown in the plot below.
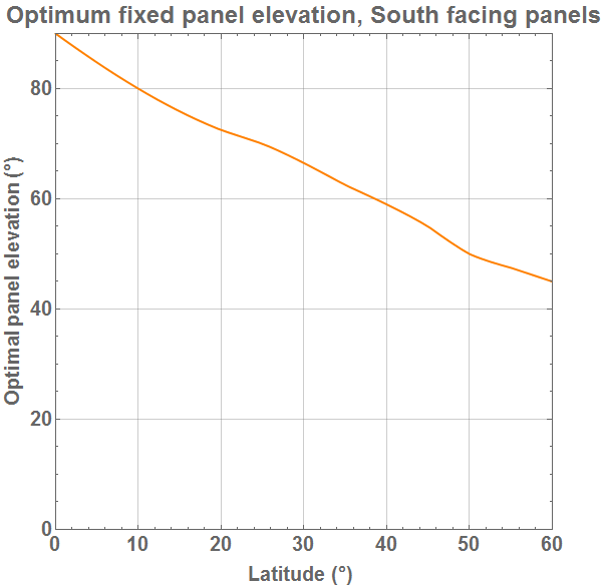
The optimal orientation is close to vertical in the tropics and about 50o elevation above the horizontal for a latitude of 50o. This particular plot ignores weather conditions and for a given solar farm location the optimum orientation will be slightly different.
The300 MW Cestas solar farm in France uses the novel arrangement of fixed orientation panels with elevation 850 and two sets of panels one set facing east the other west. With this flat arrangement there is little shadowing so the panels can be more closely spaced allowing a larger total panel area per hectare of land space.
Some solar farm use 3D tracking systems, which are optimal for power generation, while others use 1D tracking system with either an axis to change panel elevation or an axis to change panel azimuth. The 1D tracking systems are less optimal but less expensive to construct.
Below are examples of the relative power generation for the for panel arrangements in the images above. All plots ignore the influence of weather.
Relative solar power generation for different panel orientations.
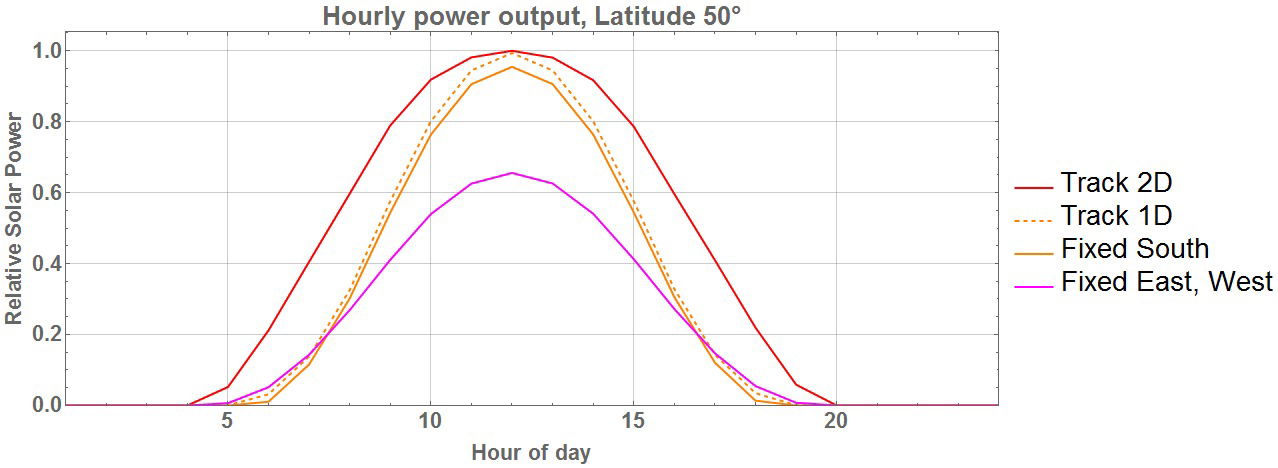
An important difference between the four orientations is the duration of time for significant generation which for >50% of peak generation ranges between 10 hours for 2D tracking to 7 hours for fixed orientation.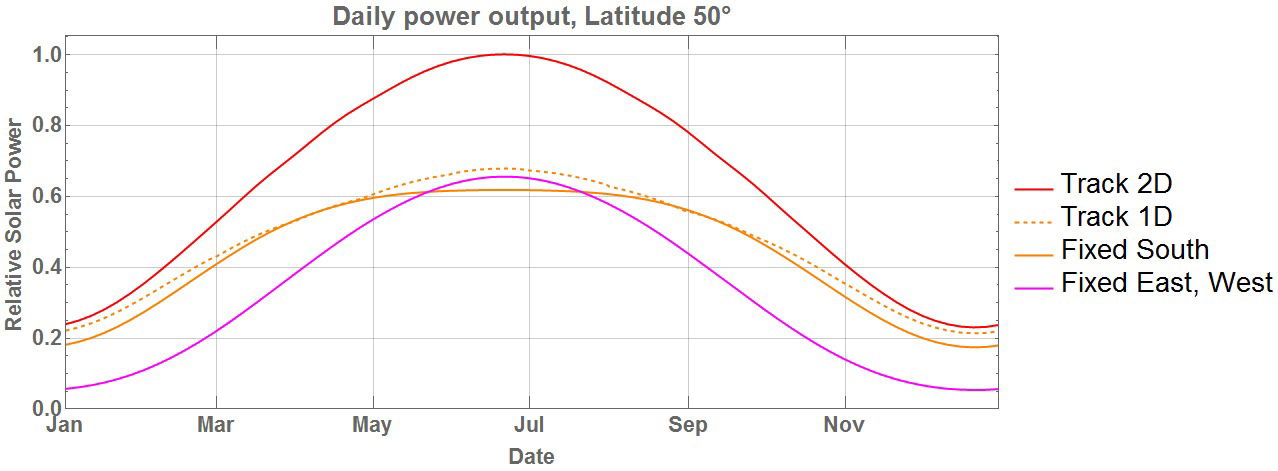
For the 2D tracker orientation the biggest gain is during the summer. The flat fixed east, west orientation losses a lot of generation in the winter.
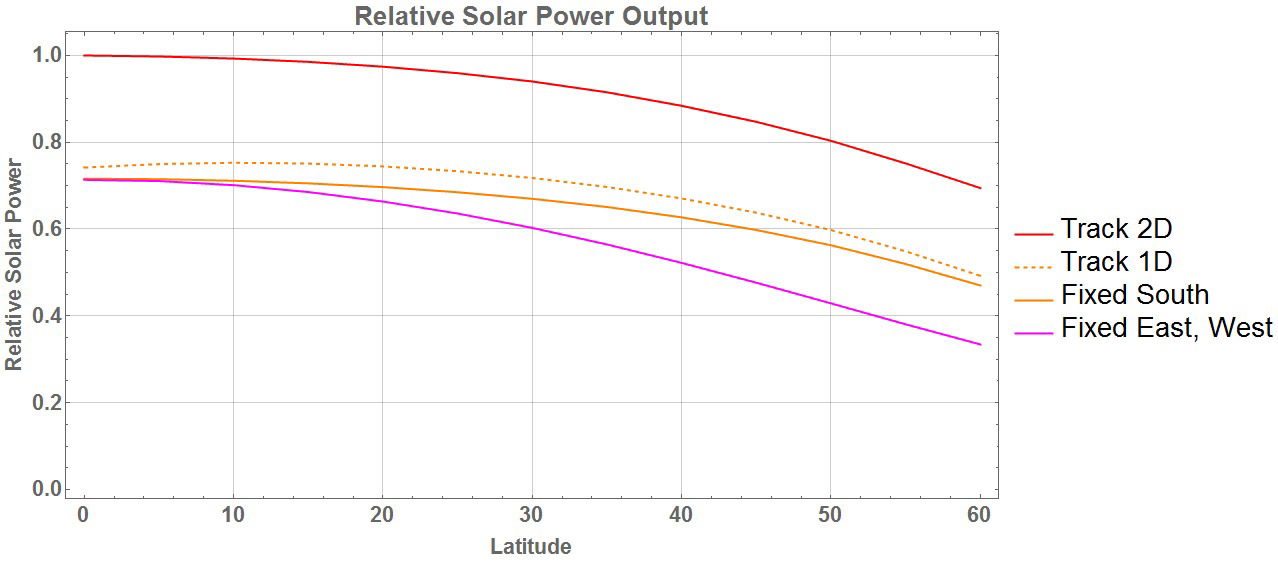
At European latitudes, relative to fixed panel orientation, 2D tracking gains +25% of power, while 1D tracking +5% and fixed east, west -10%.