Greenhouse Effect and Climate Sensitivity
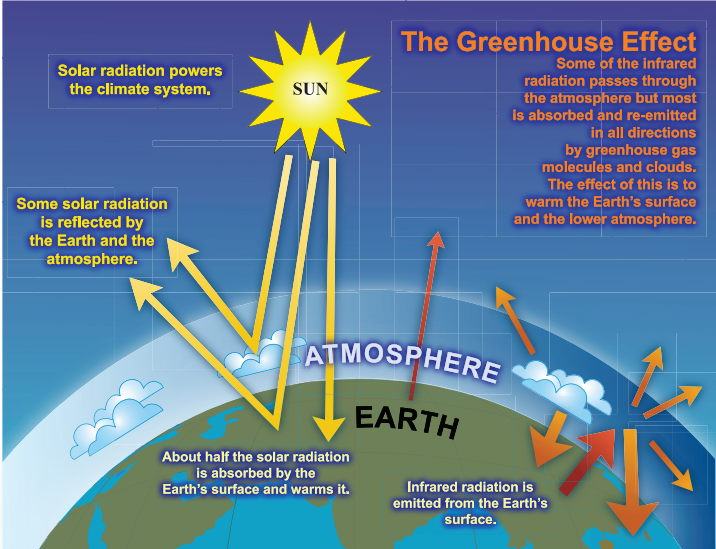
Figure 1. An idealised model of the greenhouse effect in the atmosphere of the Earth showing the principle heat exchanges in the atmosphere. The yellow arrows show short wavelength radiation from the Sun and the orange arrows show longwave length radiation emitted from the Earth.
The greenhouse effect is the process by which the atmosphere retains heat which otherwise would be radiated out to space. The name greenhouse evokes the well known horticultural glasshouse, however the atmospheric greenhouse effect has significantly different physical processes and the name often causes misunderstandings. Figure 1 gives a simplified illustration of the radiation exchanges which affect the temperature of the Earth. Radiation from the Sun arrives at the Earth and about half hits surface and heats it, while different fractions are reflected from the surface and from the atmosphere. The Earth re-radiates part of the heat absorbed with processes which produce the greenhouse effect.
The magnitude of the temperature increase is conventionally described with a parameter called the Climate Sensitivity which is the increase of the global mean surface temperature for a doubling of the CO2 in the atmosphere
Greenhouse Effect
Feature of the greenhouse effect
The heat retention happens because of differing wavelength spectra for the emission from the Sun and Earth which have different atmosphere absorptions. Figure 2 shows the radiation spectra for Sun and Earth, both following a Planck black-body distribution, but with different average wavelengths because of the average temperatures of the two sources. Figure 3 shows how these ranges of wavelength are absorbed in the atmosphere.
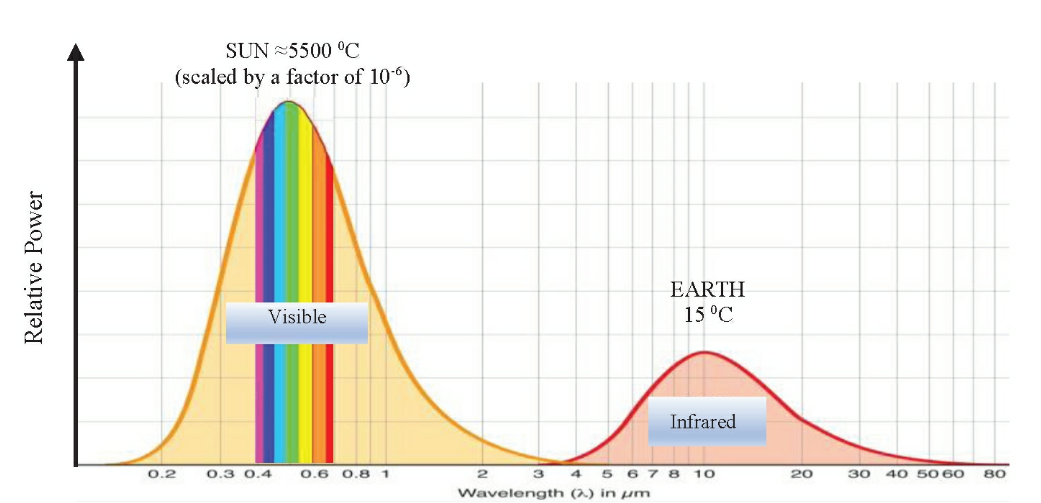
Figure 2. Planck black-body emission spectrum for the Sun and Earth, as a function of wavelength. The Sun radiates at visible wavelengths (short wavelengths, SW) because of the high surface temperature of 5500° C and the Earth at infrared wavelengths (long wavelengths, LW) for a surface temperature of 15 °C.
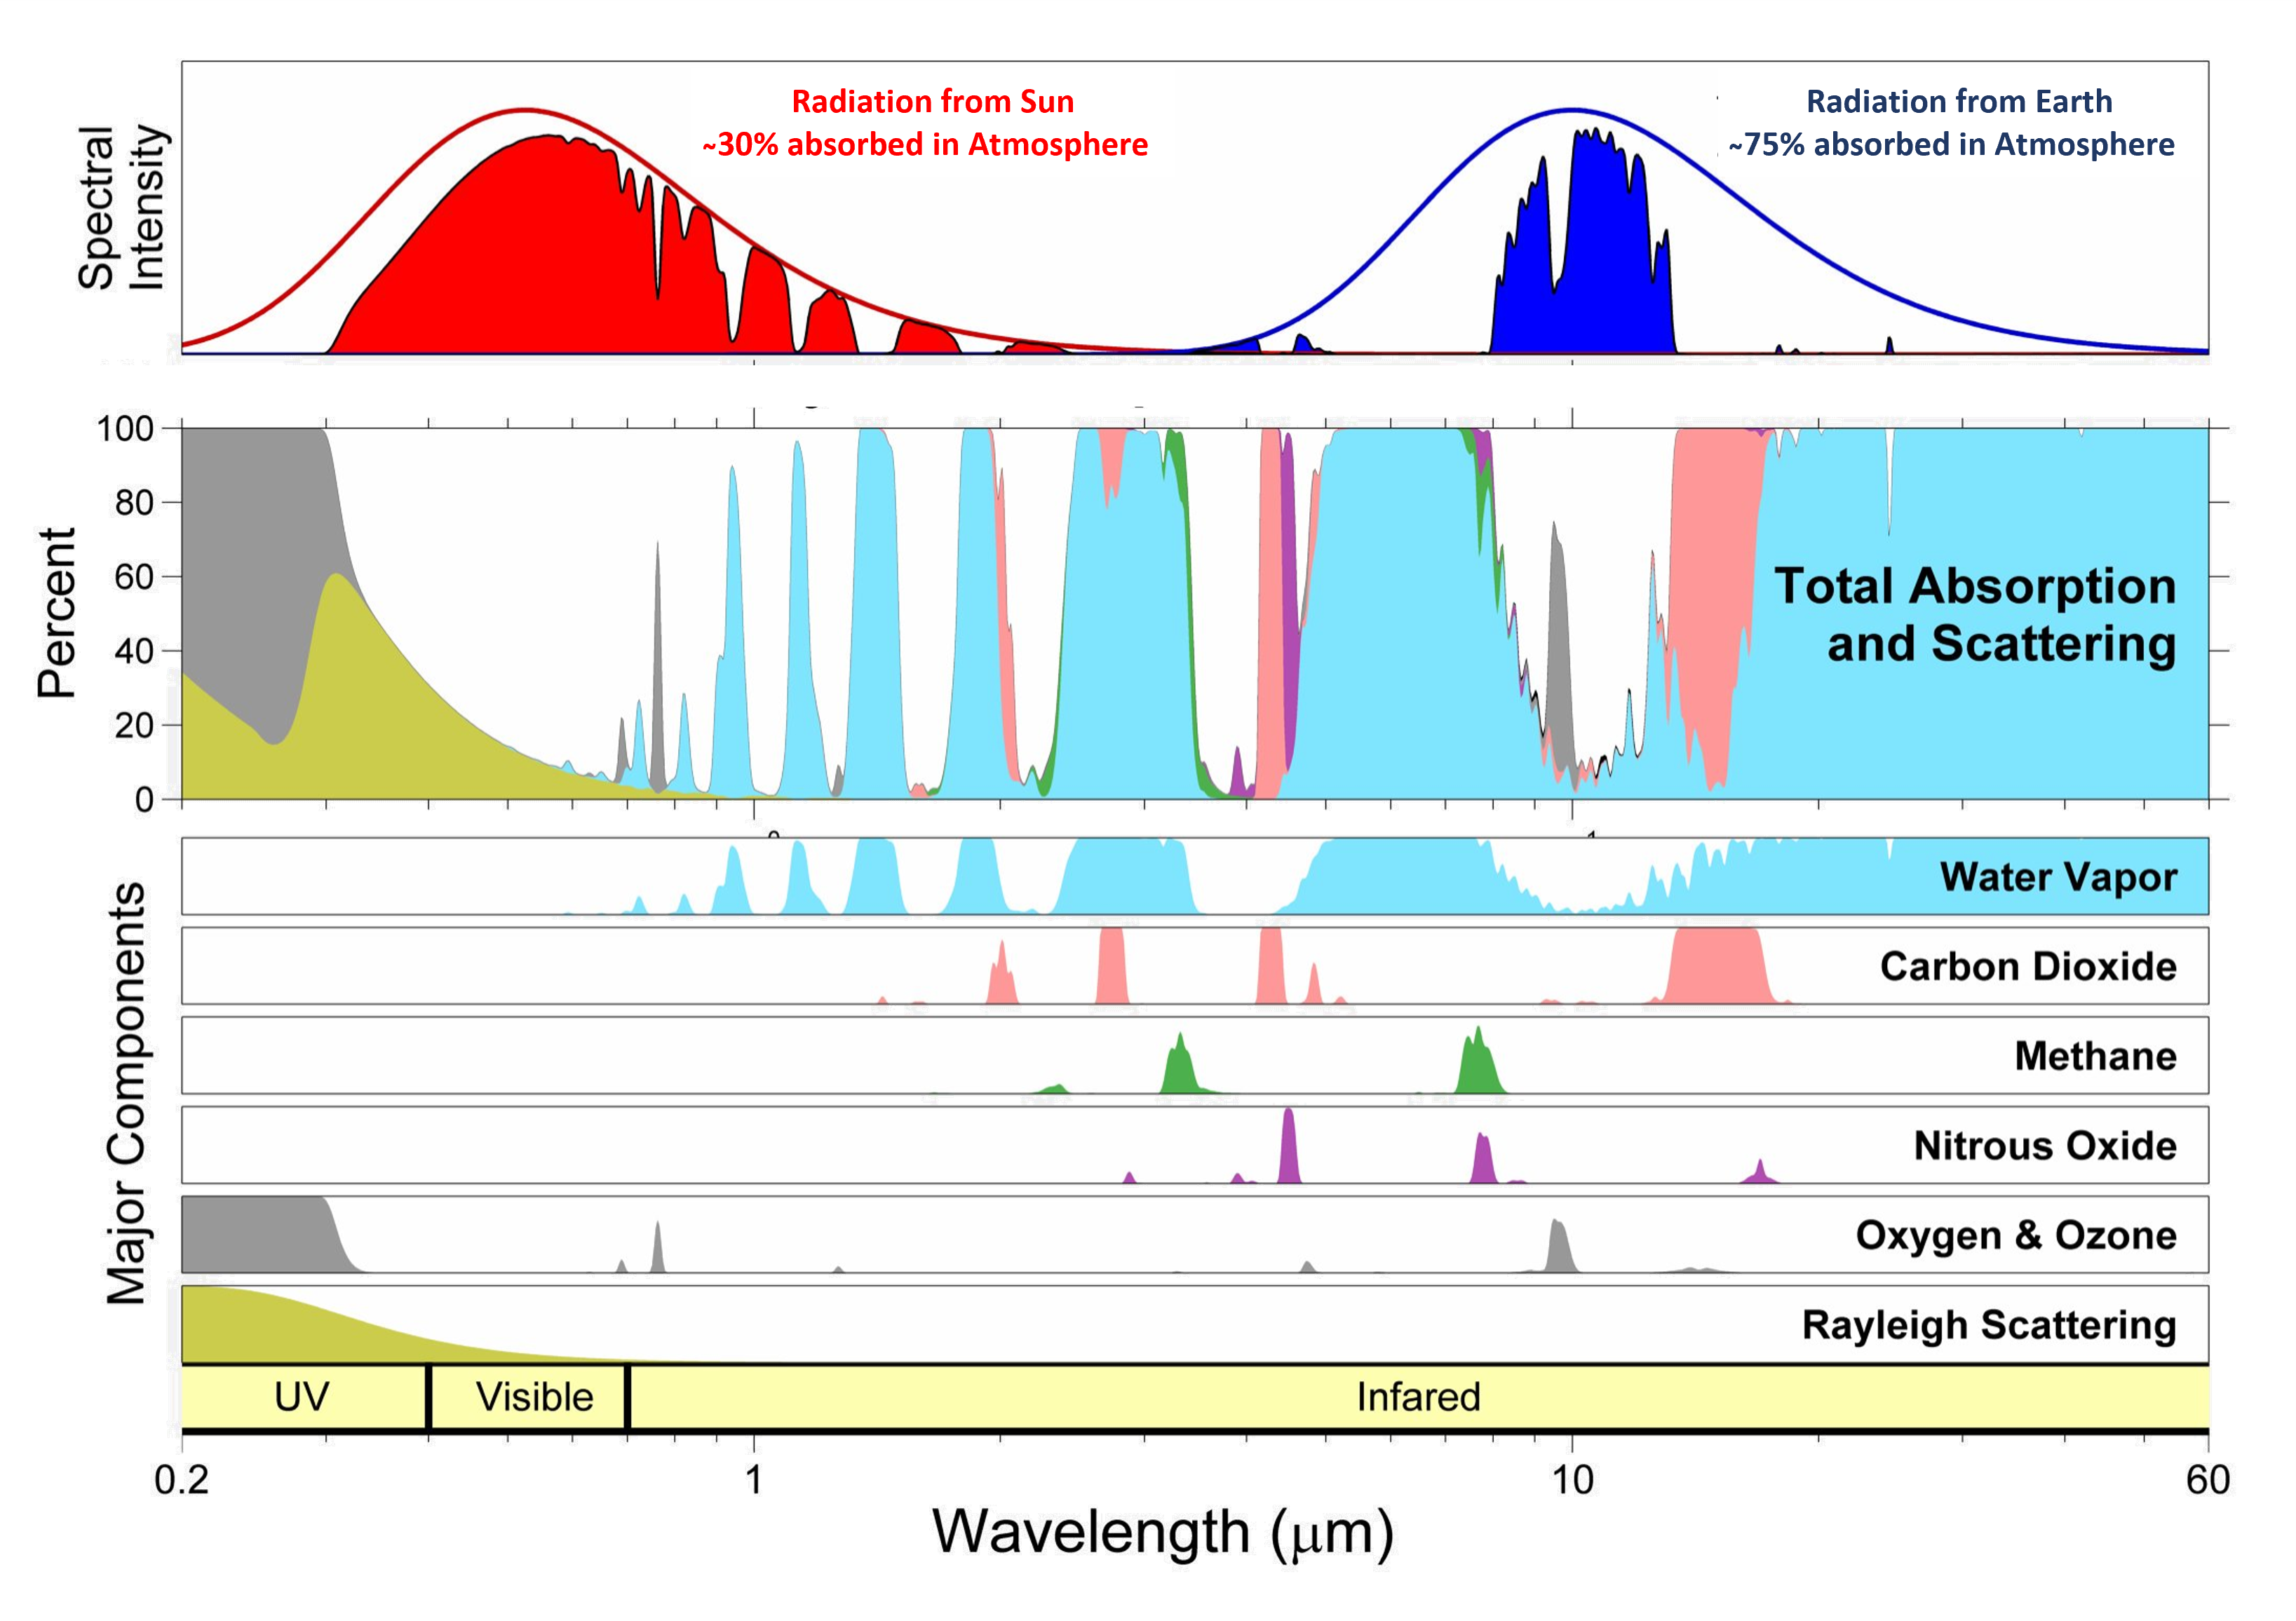
Figure 3. Radiation transmission in the atmosphere for wavelengths between 0.2 and 60 micrometres. The bottom plots show the absorption of the trace gases in the atmosphere, with water vapour in blue, carbon dioxides in pink; methane in green; nitrous oxide in purple and oxygen and ozone in grey. The green area in the ultraviolet range show the losses due to Rayleigh scattering. The middle plot combines the individual contributions to give the total absorption and scattering bands. The top plot indicates the fraction of the black-body spectrum of Sun (red) and Earth (blue) which is transmitted with the various losses.
The top plot of figure 3 shows that about 70% of the radiation from the Sun arrives at the surface of the Earth and that about 25% of the radiation re-radiated from the Earth escapes to space. It can be seen that the CO2 absorption bands often coincide with H2O absorption bands and that the absorption in some wavelength regions is saturated, so increases in CO2 concentration do not lead to large changes in the total absorption.
Figure 4 shows the fraction of the gases in the atmosphere as a function of altitude. The same figure also shows the temperature change in the atmosphere as a function of altitude, which is called the lapse rate and is an essential component of the greenhouse effect. The main components of the atmosphere, nitrogen, oxygen and argon have little effect of the absorption in the infrared wavelength range and do not influence the greenhouse effect. The gases which do have a significant contribution to the greenhouse effect are referred to as greenhouse gases (GHG) and are listed in table 1, where it is seen that water vapour and carbon dioxide have the largest contributions.
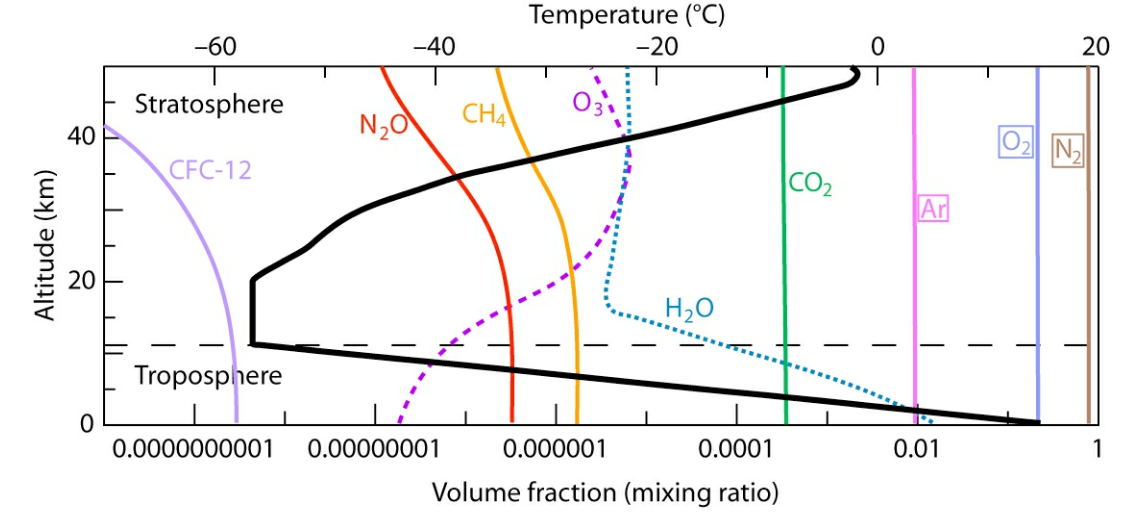
Figure 4. Atmospheric temperature and gas profiles. The thick line (upper scale) represents the vertical profile of atmospheric temperature with is called the lapse rate. The thin lines (lower scale) represent the vertical profile and abundance of atmospheric gases.
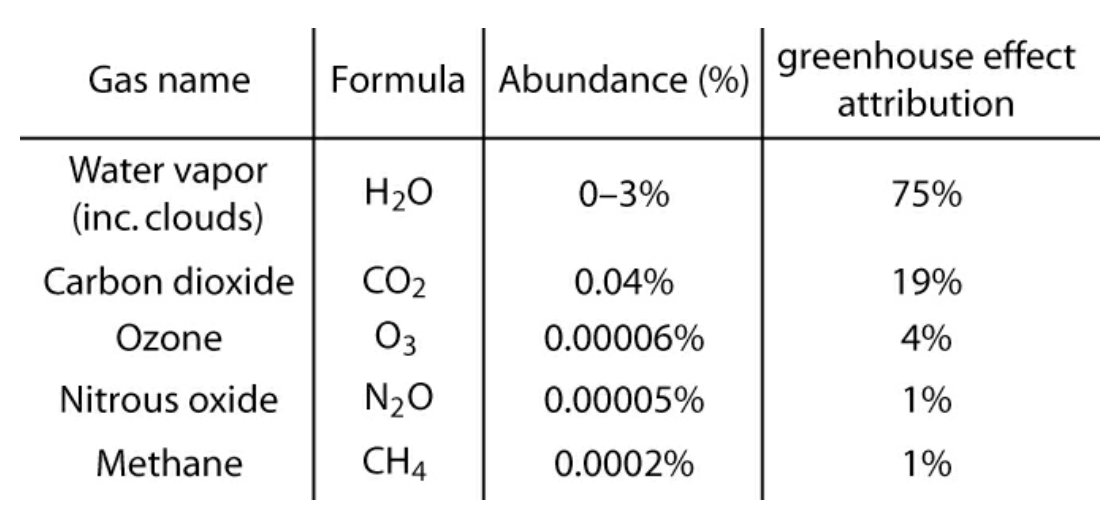
Table 1. The main greenhouse gases giving their abundance in the atmosphere and their attribution to the magnitude of the greenhouse effect.
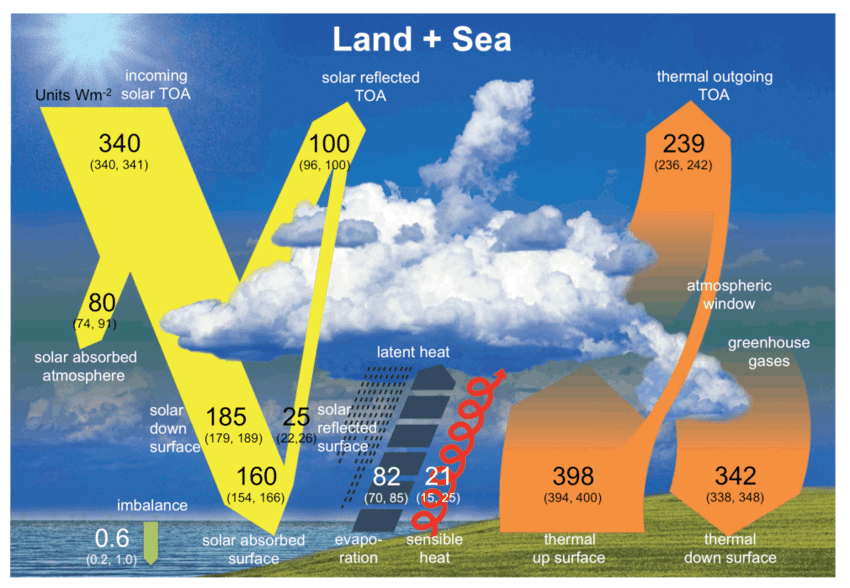
Figure 5. Radiation exchanges from the sun to the Earth and from the Earth back to the atmosphere with more details than in figure 1. The fluxes stored in the sea and land are indicated and the clouds symbolically indicate the biggest uncertainty of models. Numbers are given in W/m2 and the ranges given in parentheses are the uncertainties. (TOA - top of atmosphere.
Figure 5 indicates the complexities of the greenhouse effect. The next sections give simplifications of the full issues to help the understanding.
Two-layer model of atmosphere
Simplified models can give insights into the working of the greenhouse effect. This section is based on the book by Eli Tziperman, Global Warming Science: A Quantitative Introduction to Climate Change and Its Consequences.
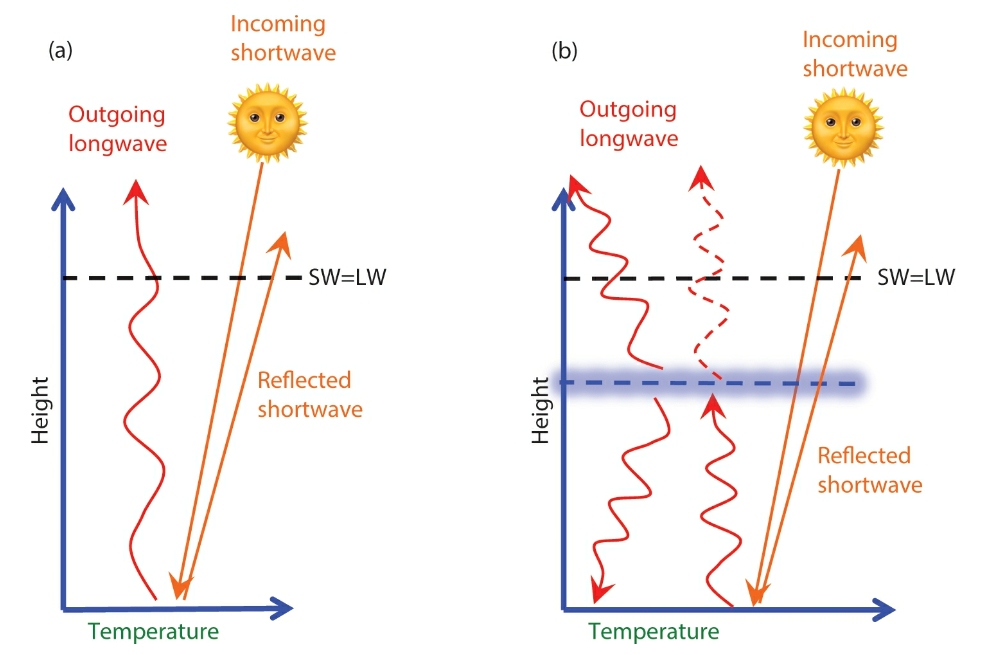
Figure 6. Cartoons depicting two energy balance models. (a) One-layer model ignoring the radiative effects of the atmosphere. (b) Two-layer model including the greenhouse effect of the atmosphere. Straight arrows indicate received and reflected SW radiation. Solid wiggly red lines denote LW radiation emitted by the surface and atmosphere; the dashed wiggly line denotes the part of the surface-emitted LW radiation not absorbed by the atmosphere.
The cartoon of figure 6(a) is for an Earth without an atmosphere. With this simple picture, the surface temperature of the Earth, T, can be calculated by is the energy balance at the top of the atmosphere. The incoming energy, corrected for area day/night and the amount of not reflected, is S0/4 (1-α) W/m2, where S0 is the solar constant (1361 W/m2) and α is the albedo (≈0.3). The outgoing radiation with no atmosphere is given by σ T4, where σ is the Stefan-Boltzmann constant (5.7 10-8 W/m2/K4). The balance LW =SW is:
giving T = 255°K = -18°C, much colder than the real surface temperature.
With an atmosphere, cartoon figure 6(b), a fraction, ε, of the upgoing radiation is absorbed. The cartoon depicts an "emission height" where on average half this radiation goes up and half goes down. The balance LW=SW is then:

With ε=0.75, this gives T = 284°K = 13°C, which is close to real global average surface temperatures. Figure 7 shows the surface temperature for the two-layer model for a range of parameters.
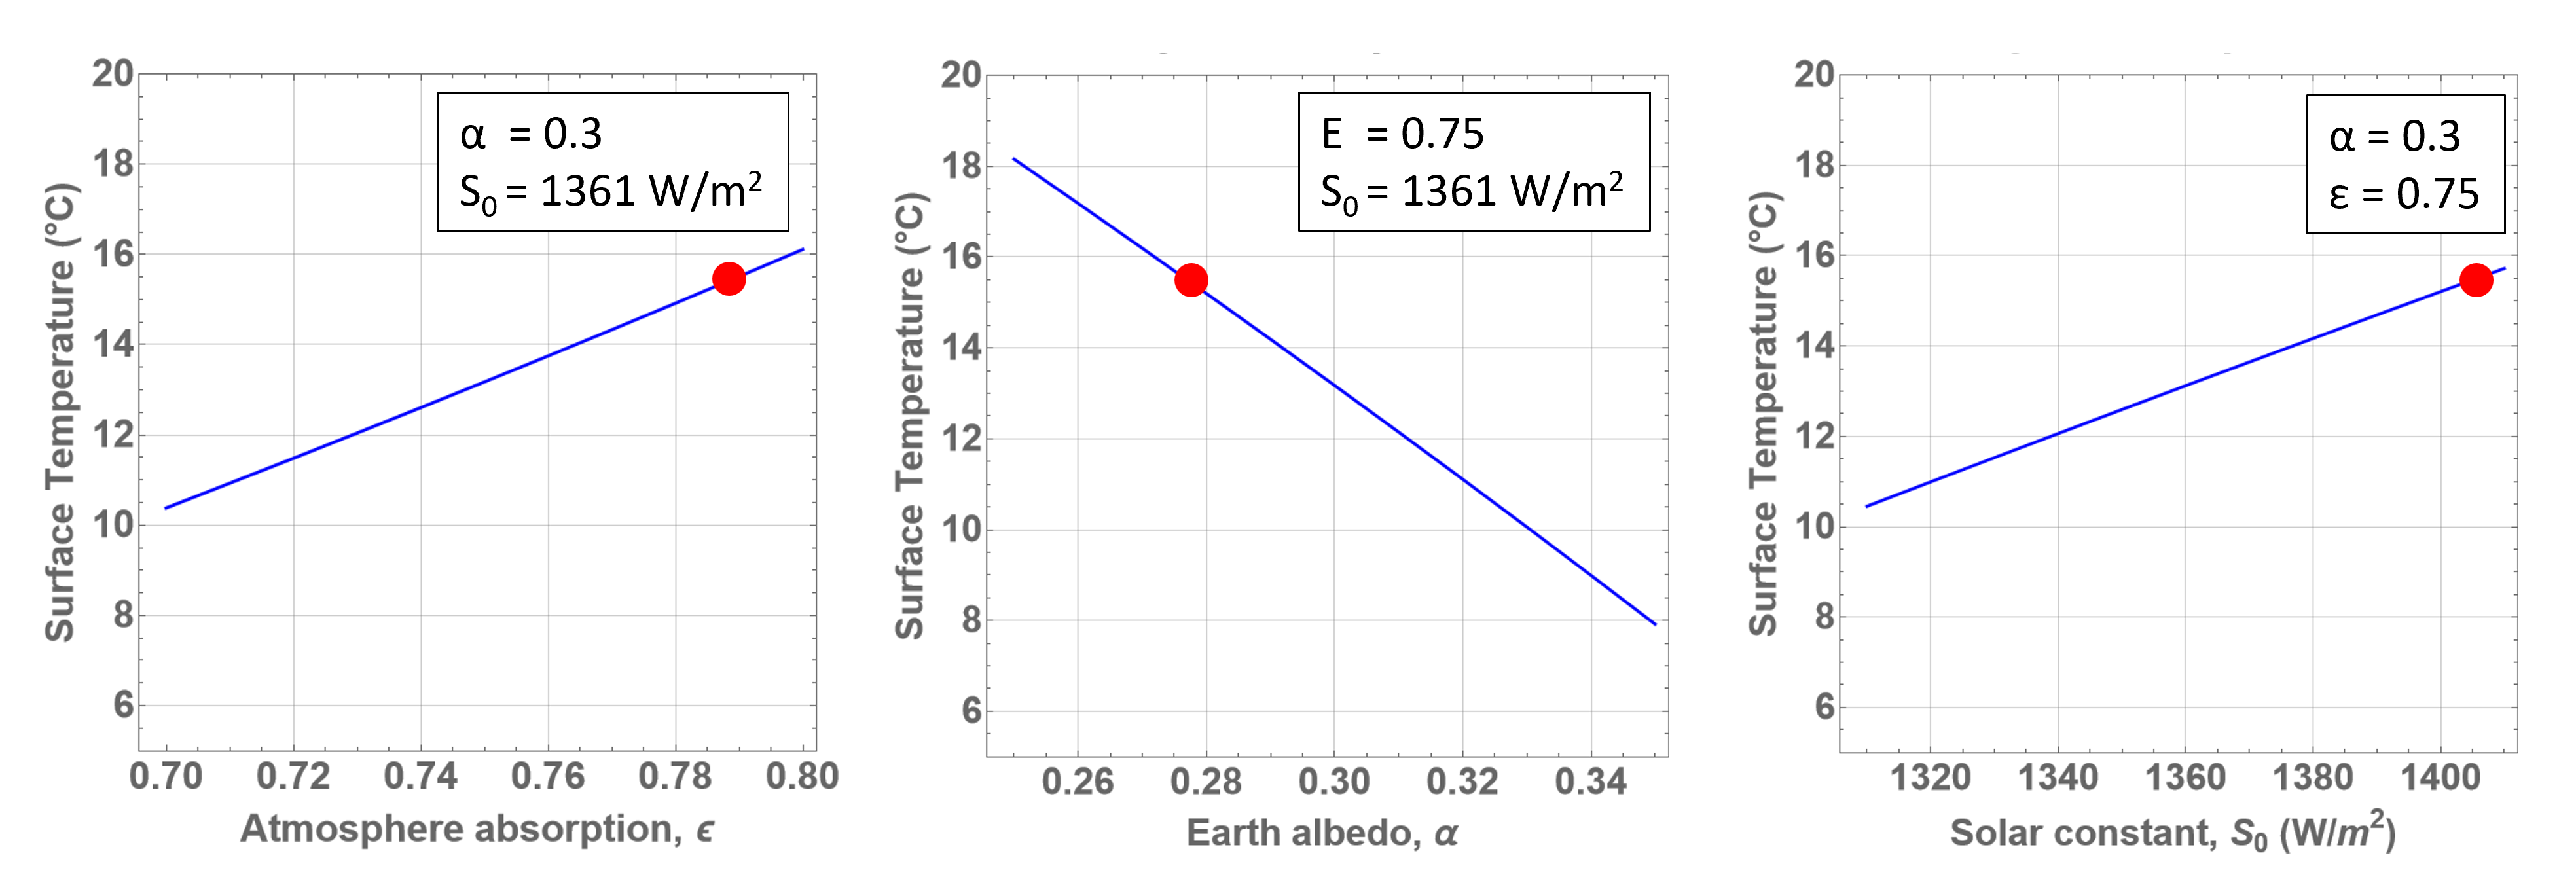
Figure 7. In the simple two-layer atmospheric model described in the text, surface temperature predictions for a range of input parameter: ε, fraction of the upgoing radiation is absorbed; α, the albedo; S0, the solar constant. The red dot indicates a surface temperature of 15°C showing the model is not far from predicting real global temperatures.
Although this simple model can predict that an infrared absorbing atmosphere is needed to roughly explain the Earth's actual surface temperature, it does not predict the magnitude of the temperature increases attributed to increasing CO2 in the atmosphere. From figure 3 it can be calculated that a doubling of CO2 in the atmosphere only gives a 1% increase in the absorption fraction, ε, which in turn only gives an increase of 0.6°C in surface temperature which is less than the real situation.
Emission height and lapse rate
Different from the two-layer model atmosphere, discussed in the section above, the real atmosphere has a temperature which decreases with altitude in the troposphere as seen in figure 4. An essential feature of the explanation of the real greenhouse effect is that with an increase in GHG the average emission height of infrared radiation moves to a higher altitude where the temperature is lower and so the radiation flux is lower. To compensate for this this surface temperature increases.
Figure 8 schematically shows how this process works. The effective emission height (Ze in the figure) is the average altitude at which the thermal radiation is emitted and is an altitude of about 6 km with temperature at this height of about -23°C. An increase in GHGs causes increases temperature at lower altitudes but cooling at higher altitudes. To balance incoming and outgoing radiation so that the Earth reaches equilibrium, the emission temperature (Te) must remain constant and the emission height (Ze) must increase. A doubling of CO2 concentration would cause the emission height to increase by 150 meters where with no change in temperature profile the temperature would be about 1°C cooler than it should be. To reach a balance of radiation, LW= SW, the surface temperature must increase by 1.2°C to reach the required emission temperature at the new height.
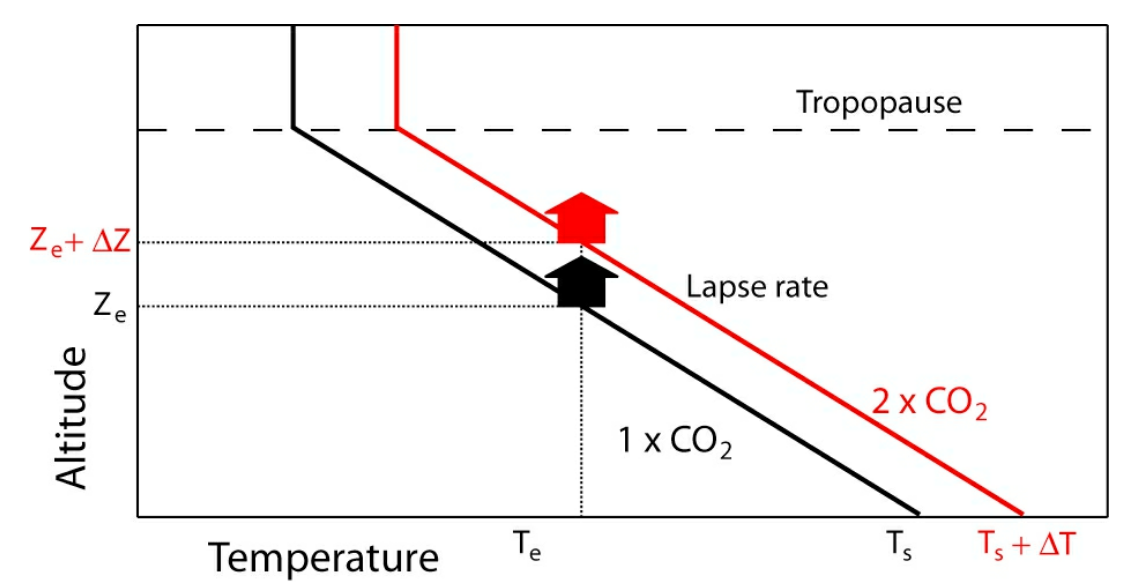
Figure 8. Schematic diagram of the change in the lapse rate of the atmosphere to the greenhouse effect. The change in emission level (Ze) due to a doubling of CO2 (red) is associated with an increase in surface temperature (Ts), assuming a fixed atmospheric lapse rate. The effective emission temperature (Te) and the outgoing longwave emissions remain unchanged.
Climate Sensitivity
Climate sensitivity is defined as the change in surface temperature when the CO2 concentration is doubled and its magnitude is at the heart of the debate on anthropogenic climate change. There are different definitions with the most popular: the Transient Climate Response (TCR) which is the temperature increase at the instant that atmospheric CO2 has doubled and the Equilibrium Climate Sensitivity (ECS) which is the increase when the Earth has reached equilibrium after 100s or 1000s of years;
The 1979 Charney Report Carbon Dioxide and Climate: A Scientific Assessment estimated the ECS to be between 1.5 and 4.5°C and this range was given as the same range in the 2014 IPCC AR5 report as the likely range 66% confidence level range. The more recent, 2021 IPCC AR6 report narrowed the likely range of ECS to 2.5–4.0°C. These climate sensitivity estimate have multiple inputs: Process understanding; Climate model simulations; Historical observations and Paleoclimatic observations and combining the various methods to obtain an overall best estimate is very controversial. After more than 40 years of investigation the uncertainty on the climate sensitivity remains very large.